LLM Observability and Tracing
On this page
A support assistant's thumbs-down rate jumps 40% on a Tuesday afternoon. The service is up, latency is normal, and error rates are flat. The logs show "200 OK" for every request. Finding the cause means answering questions ordinary monitoring can't: which prompt version and model handled these requests, what was retrieved, which tools were called and what they returned, and what the model actually said. LLM observability is tracing every step of every request (retrieval, model calls, tools, guardrails) with the prompt, model, tokens, cost and quality signals attached, so you can go from "users are unhappy" to the exact broken step.
How it works
Traces and spans
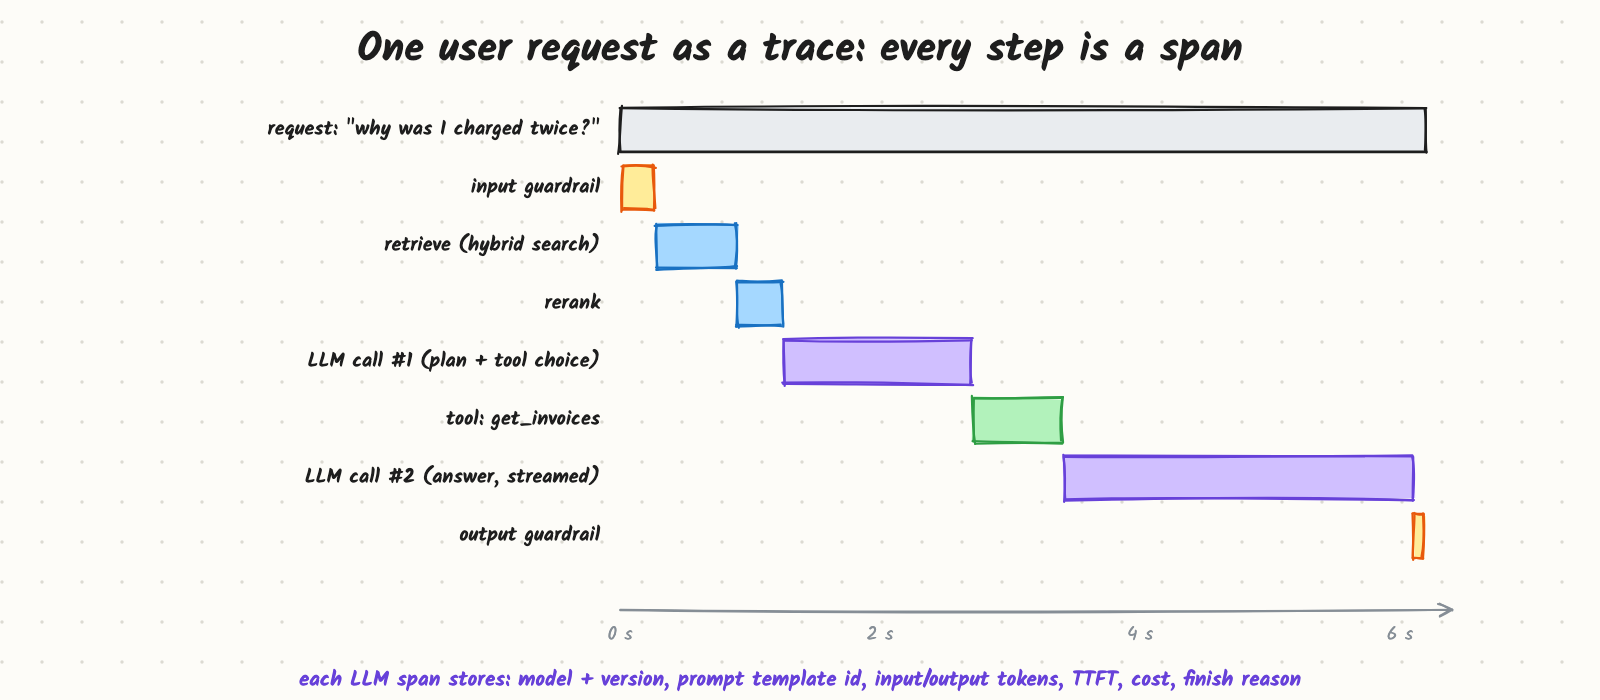
A trace is one user request; each step inside it is a span with a start time, duration, parent and attributes. For an LLM feature the spans are typically: input guardrail, retrieval, reranking, each model call, each tool call, output guardrail. Agent runs produce deeper trees: loops of model calls and tools, sub-agents.
Each LLM span should record:
- Model and version (provider, model ID, deployment), and the prompt template ID and version.
- Input and output (full text on a sampled, redacted basis), or a reference to where they're stored.
- Tokens (input, cached input, output), cost, TTFT, total latency, finish reason (stop, length, tool call, content filter).
- Parameters (temperature, max tokens), retries, and whether a fallback model was used.
Retrieval spans record the query, top-k document IDs and scores; tool spans record arguments, result size and errors. Everything shares a trace ID plus user or tenant ID, so you can filter.
OpenTelemetry has emerging semantic conventions for generative AI spans, and many LLM observability tools (open-source and hosted) accept OpenTelemetry data; using it avoids lock-in.
Signals beyond the trace
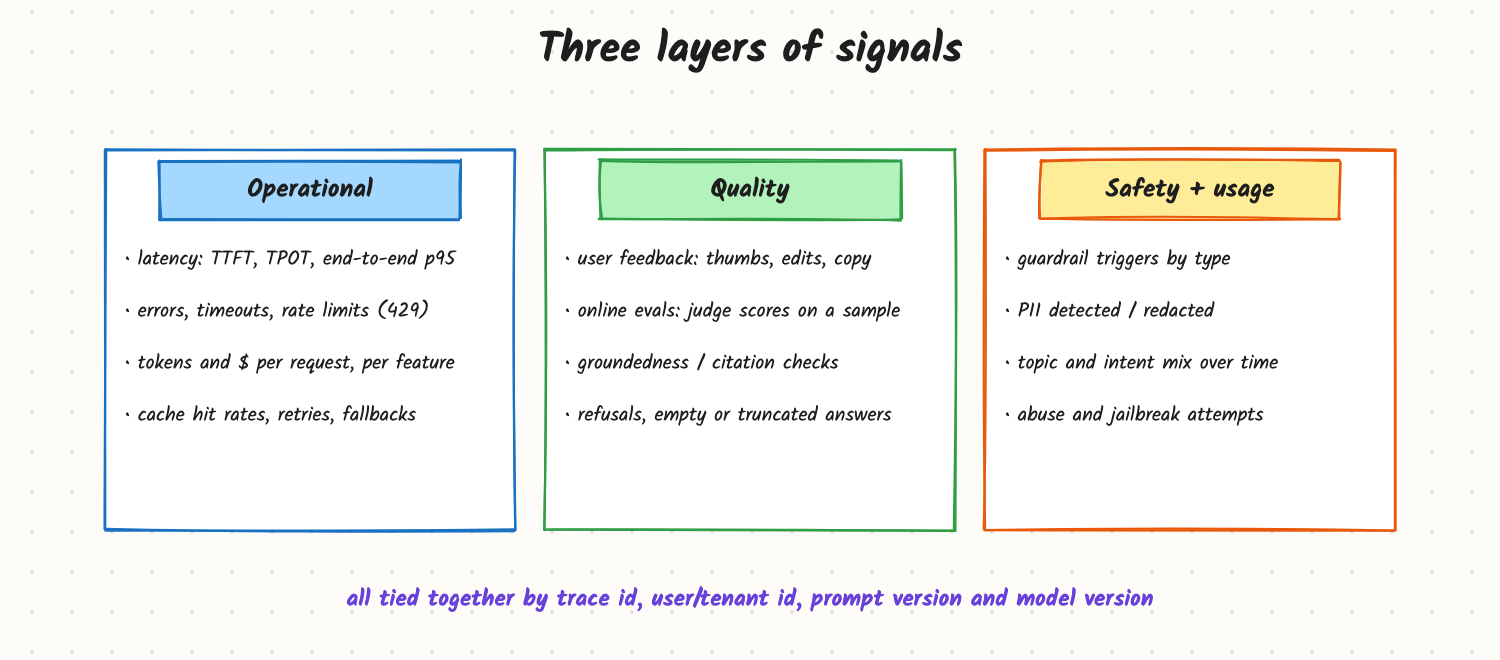
- Operational: latency percentiles, errors, rate limits, tokens and cost per feature and per tenant, cache hit rates, retries and fallbacks.
- Quality: explicit feedback (thumbs, ratings), implicit feedback (user edits the answer, copies it, rephrases the question, escalates to a human), online eval scores from an LLM judge on a sample, groundedness checks, refusal and truncation rates (see Online Evaluation and A/B Tests).
- Safety and usage: guardrail triggers by type, PII detections, jailbreak attempts, and the mix of intents and topics over time, which shows drift.
From alert to fix
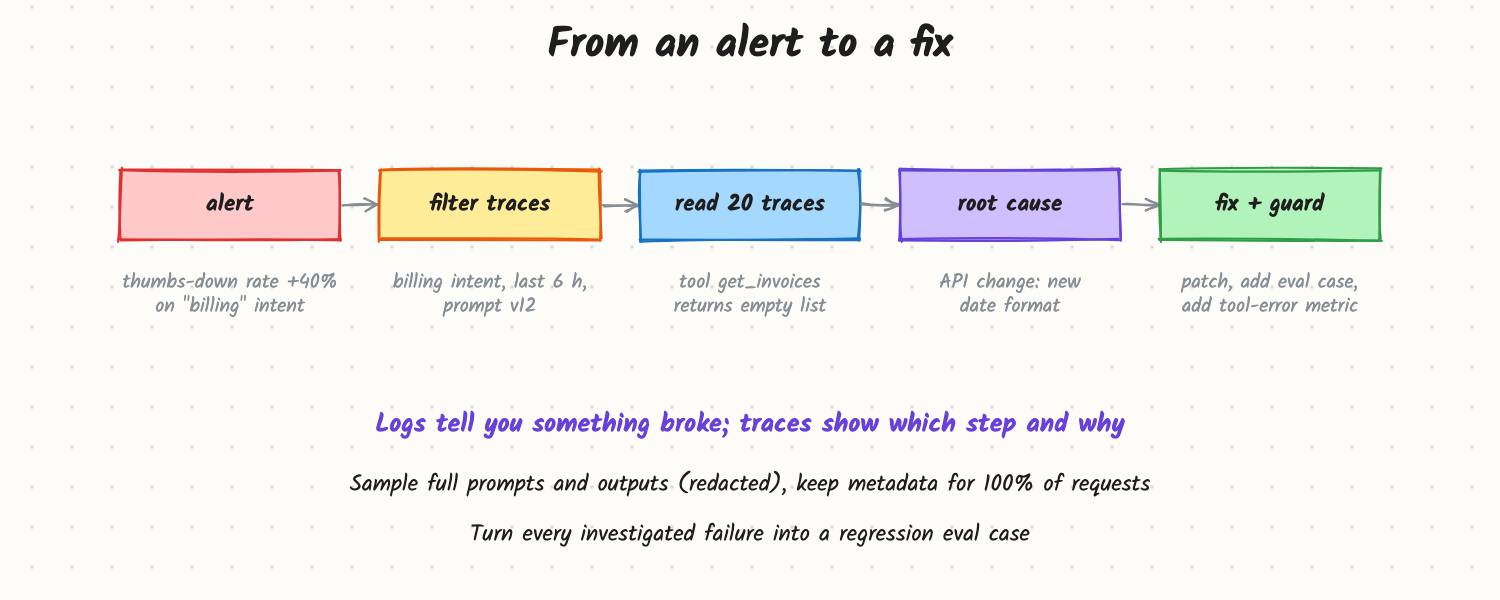
- Alert on a quality or cost metric, broken down by feature, intent, prompt version and model.
- Filter traces to the affected slice and time window.
- Read a couple of dozen traces end to end. The cause is usually visible: empty retrieval, a tool error swallowed by the model, a prompt change, a model version switch.
- Fix, then add the failing cases to the regression eval set and add a metric for the failure mode (for example tool errors per request).
Trade-offs and costs
- Volume and cost: full prompts and outputs are large; long contexts make traces huge. Keep metadata for 100% of requests, full text for a sample (plus all flagged or negative-feedback requests).
- Privacy: prompts contain personal and confidential data. Redact at capture, encrypt, restrict access, set retention limits, and respect customer data agreements.
- Overhead: tracing must be asynchronous and must never fail the request.
- Build vs buy: hosted LLM observability tools are quick to adopt; self-hosting keeps data in your environment.
In production
- Instrument at the gateway or SDK layer so every model call is traced by default, not per feature.
- Dashboards per feature: p95 latency, cost per request, thumbs-down rate, judge scores, guardrail triggers, broken down by prompt version and model.
- Alerts on rates and ratios, not single events: thumbs-down rate, empty-retrieval rate, tool error rate, cost per request.
- Link traces to releases: every deploy of a prompt, model or retrieval config appears as an annotation on the charts.
- Make it easy for anyone (support, product) to open a trace from a user report.
When to reach for it
From the first production LLM feature onwards. Agents, RAG and multi-step workflows especially, since a failure can come from any step, and "the model said something wrong" is rarely the real root cause.
Example
The Tuesday incident: the thumbs-down alert is scoped to the "billing" intent. Filtering traces from the last 6 hours on that intent shows the get_invoices tool returning an empty list in 85% of calls since 2:10 pm; the model then apologises vaguely. The billing API had switched to a new date format and the tool wrapper's query no longer matched. The fix ships in an hour; the team adds a "tool returned empty" metric with an alert, and 20 of the failing conversations become eval cases. (Example scenario.)
Common mistakes
- Logging only HTTP status and latency: LLM failures return 200 OK.
- Not recording prompt and model versions, so changes can't be correlated with quality.
- Storing full prompts with personal data without redaction or retention rules.
- Dashboards without breakdowns by feature, intent, version and tenant.
- Investigations that don't end in eval cases, so the same bug returns.
Say this in the interview
"I'd trace every request end to end, with a span per step: guardrails, retrieval, each model call, each tool call. LLM spans record model and prompt versions, tokens, cost, TTFT and finish reason; retrieval and tool spans record what came back. On top I'd track operational metrics, quality signals like feedback and sampled judge scores, and safety signals, all broken down by feature, intent and version. Metadata for every request, full text for a redacted sample plus all flagged requests. When a quality alert fires, filter traces, read them, fix the step, and add the cases to the regression evals."
Interview questions on this
- What would you record for each LLM call? Model and version, prompt version, tokens, cost, latency, TTFT, finish reason, parameters, sampled input and output.
- How do you detect quality regressions with no errors? Feedback rates, judge scores on samples, refusal and empty-retrieval rates, by version.
- How do you handle PII in traces? Redact at capture, encrypt, restrict access, set retention, sample.
- How do you trace an agent? A span tree: each loop iteration's model call and tool calls, with parent links and step counts.
- Why record prompt version on every call? To correlate quality and cost changes with deploys and roll back precisely.
- What alerts would you set? Thumbs-down rate, cost per request, p95 latency, tool error rate, guardrail trigger rate.
Used in
- AI Engineering: Online Evaluation and A/B Tests for LLM Features; Versioning Prompts and Models, and Rolling Them Out; Model Routing and Fallbacks; Your RAG Answers Are Wrong: How Do You Debug It?; Your Agent Is Stuck in a Loop; Making Agents Reliable.
- AI System Design: Design an LLM Gateway; Design a Customer Support Agent; Design an Eval Platform.