Offline Metrics: Precision, Recall, AUC, NDCG
On this page
Your new model scores 0.83 AUC, up from 0.81. Should it ship? The interviewer's follow-up is always the same: "Why AUC? What does 0.83 mean for the user? And what would you compare it against?" Offline metrics are how you decide whether a model is worth an A/B test at all, so you need to pick the one that matches your label and your decision, and explain it in plain words.
How it works
Classification: precision, recall and the threshold
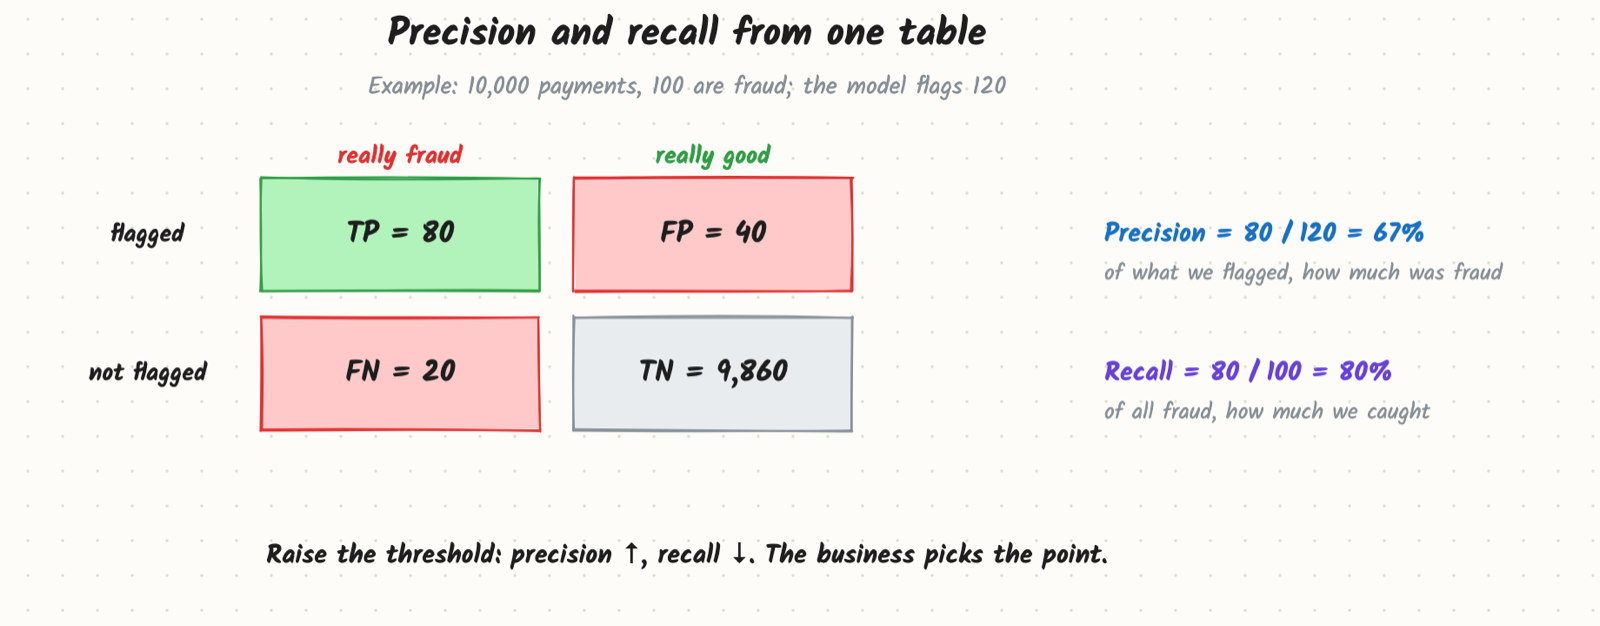
A classifier outputs a score; a threshold turns it into a decision. Each decision lands in one of four boxes: true positive, false positive, false negative, true negative.
- Precision = TP / (TP + FP): of everything we flagged, how much was really positive. Low precision means annoyed users: good payments declined, real emails in spam.
- Recall = TP / (TP + FN): of all real positives, how many we caught. Low recall means harm gets through.
- F1: the harmonic mean of the two, a single number when both matter equally. In practice they rarely matter equally.
Moving the threshold trades one for the other. So the useful question is not "what is the precision?" but "what is the recall at the precision (or false-positive rate) the business accepts?"
Threshold-free summaries: ROC-AUC and PR-AUC
- ROC-AUC: the chance that a random positive gets a higher score than a random negative. 0.5 is random, 1.0 is perfect. It measures ranking quality and ignores calibration.
- PR-AUC: the area under the precision–recall curve. When positives are rare (fraud, harmful content), ROC-AUC can look excellent while precision at any useful threshold is poor; PR-AUC exposes that.
Use AUC to compare models quickly; use precision and recall at the operating point to decide.
Probabilities: log loss and calibration
When the score is used as a number, not just to sort (ad auctions, expected-value decisions, combining several model outputs), it must be calibrated: among items scored 0.10, about 10% should turn out positive.
- Log loss (cross-entropy): punishes confident wrong predictions; it measures calibration and ranking together. The standard for click-prediction models.
- Calibration plot or expected calibration error: bucket predictions by score and compare the average score with the actual rate in each bucket.
- Normalised log loss divides by the log loss of always predicting the base rate, so you can compare across datasets with different click rates.
Ranking: NDCG, MAP, recall@k
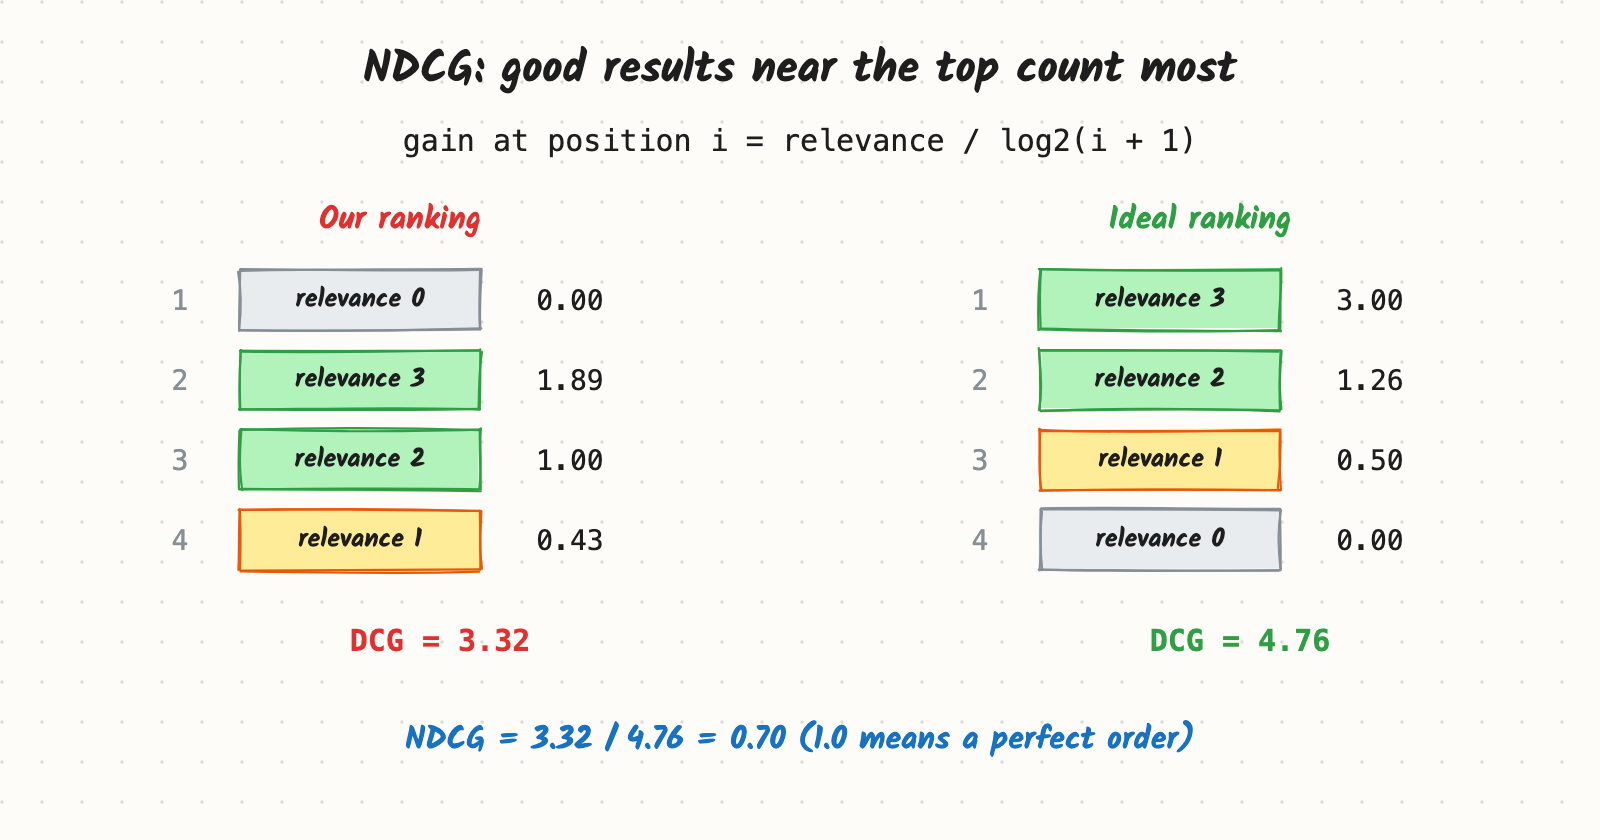
For a ranked list, what matters is whether the good items are near the top.
- Recall@k: of the relevant items, how many appear in the top k? The standard metric for the retrieval stage, which only needs to get good candidates into the set.
- Precision@k: of the top k, how many are relevant?
- MAP (mean average precision): averages precision at each relevant item's position; for binary relevance.
- NDCG@k: for graded relevance (0–3). Each result's relevance is discounted by
log2(position + 1), summed (DCG), and divided by the DCG of the ideal order. 1.0 means a perfect order. The standard for search and feed ranking. - MRR (mean reciprocal rank): 1 / the position of the first relevant result; good when the user needs only one answer (autocomplete, navigational search).
Regression: MAE, RMSE, percentage errors
For numbers such as trip time or price: MAE (mean absolute error, easy to explain: "off by 2.1 minutes on average"), RMSE (punishes big misses more), MAPE (error as a percentage, comparable across short and long trips, but unstable near zero). Also report error by bucket, because a 3-minute error on a 5-minute trip is far worse than on a 60-minute one.
Trade-offs and costs
| Metric | Use when | Watch out for |
|---|---|---|
| Precision / recall at a threshold | a yes/no decision with known costs | depends on the threshold you choose |
| ROC-AUC | comparing rankers, balanced-ish data | misleading with rare positives; ignores calibration |
| PR-AUC | rare positives | harder to explain; changes with base rate |
| Log loss + calibration | the score is used as a probability | sensitive to sampling; correct for downsampling first |
| Recall@k | retrieval stage | ignores order within the top k |
| NDCG@k | ranked lists with graded relevance | needs graded labels; position bias in click labels |
| MAE / RMSE | numeric predictions | one average hides bad segments |
The biggest trade-off is offline versus online: offline metrics are cheap and fast but only approximate the product metric. Always say which offline metric you'll use to filter models and which online metric decides.
When to reach for it
Step 6 of the framework, before the A/B test. Also whenever you compare two models, set a threshold, or are asked "how do you know the model is good?"
Example
Prompt: "Design search ranking for an online store."
- Retrieval stage: recall@500, measured on queries whose purchased product is known: did the purchased product make it into the 500 candidates?
- Ranking stage: NDCG@10 with graded labels: purchase = 3, add to cart = 2, click = 1, no interaction = 0. Debias clicks by position (see Feedback Loops), and add a small set of human-rated queries for truth.
- Calibration: not needed for sorting alone; needed if the ranking score is blended with ads by expected revenue.
- Segments: head queries, tail queries, new products, each language.
- Online: purchases per search session, with zero-result rate and latency as guardrails.
Common mistakes
- Accuracy on imbalanced data.
- ROC-AUC alone for a problem where positives are 0.1%.
- Evaluating on downsampled data or forgetting to recalibrate.
- One overall number with no segments; the new model may be worse for new users.
- NDCG on raw clicks without considering position bias.
- No baseline: a metric means nothing without the current model's number on the same data.
Say this in the interview
"For retrieval I'll measure recall at 500, because that stage only needs to get the right items into the candidate set. For ranking I'll use NDCG at 10 with graded labels from purchases, carts and clicks. Since the score also feeds the ads blend, I'll check calibration too. A new model must beat production on the same time-split test set, overall and for new users and tail queries, before it goes to an A/B test."