Online Metrics and A/B Testing
On this page
A new ranking model wins every offline metric. You launch it to everyone on Monday, and by Friday daily active users are up 2%. Success? You can't tell. Friday was a holiday, a marketing campaign started on Tuesday, and a competitor had an outage on Wednesday. Without a control group, the 2% could be anything.
Offline metrics tell you a model might be better. Only an online experiment tells you it is, measured on the product metric the business cares about. This page covers how to set one up, how big and how long it must be, and the traps that make results wrong.
How it works
The basic experiment
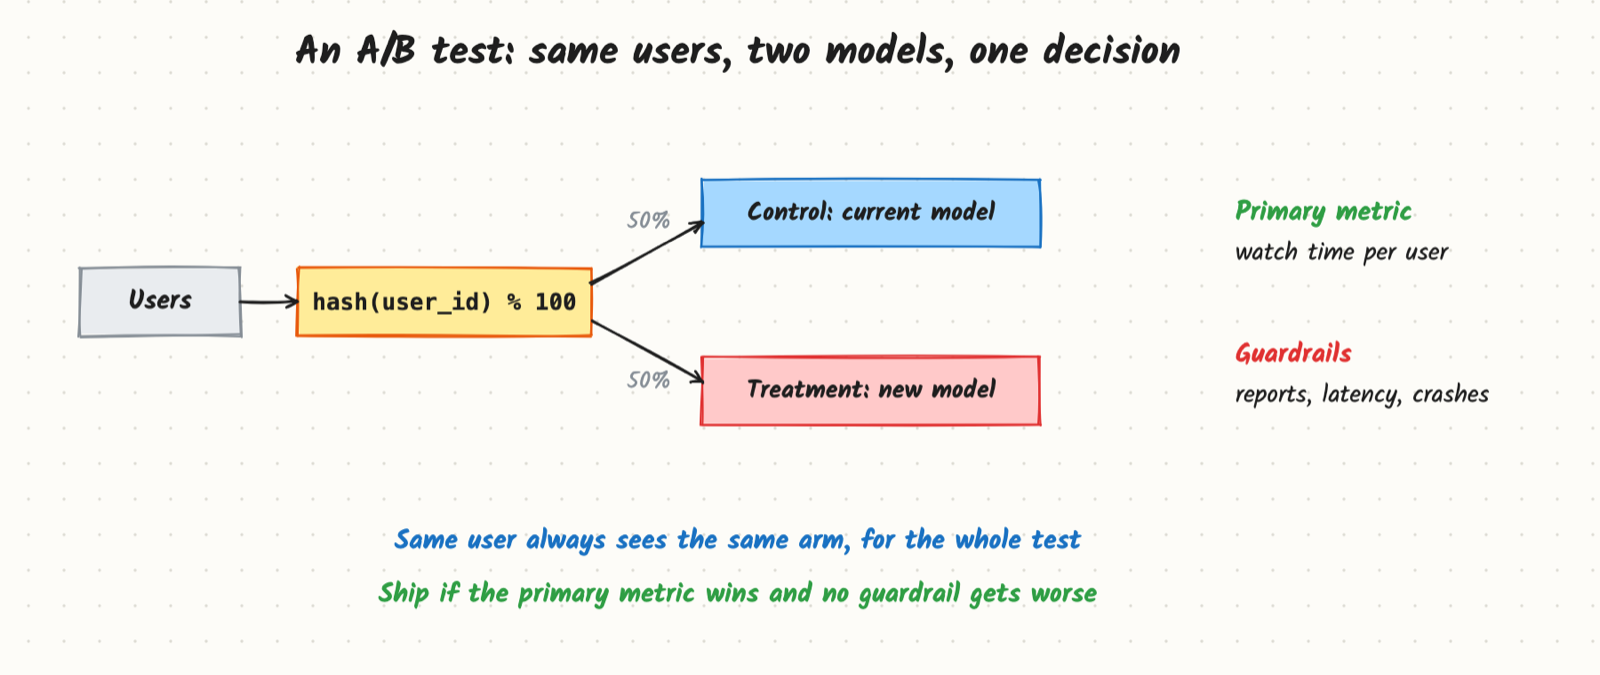
- Randomise by user. Hash the user ID with an experiment-specific salt and take it modulo 100. Buckets 0–49 get the current model (control), 50–99 get the new model (treatment). The same user always lands in the same arm, so their experience is consistent and their behaviour is counted once.
- Pick one primary metric that matches the business goal: watch time per user, purchases per user, fraud losses per dollar processed. Decide it before the test starts.
- Pick guardrail metrics that must not get worse: report rate, unsubscribes, latency, crash rate, revenue if the primary metric is engagement.
- Run, then decide: ship if the primary metric improves with statistical significance and no guardrail degrades beyond a set tolerance.
Often a test starts at 1% of traffic for a day to catch bugs, then ramps to 50/50 for the real measurement.
Online metrics by problem type
| Problem | Primary metric | Guardrails |
|---|---|---|
| Feed or video recommendations | time spent, sessions per user | reports, hides, "not interested", creator diversity |
| Search | successful sessions (click with long dwell, or purchase) per search | zero-result rate, query reformulation rate, latency |
| Ads | revenue per thousand impressions | ad click-through, user engagement, advertiser return |
| Fraud | fraud losses per dollar | good-customer decline rate, review queue size |
| Notifications | daily active users | opt-out rate, notifications sent per user |
How many users, and how long
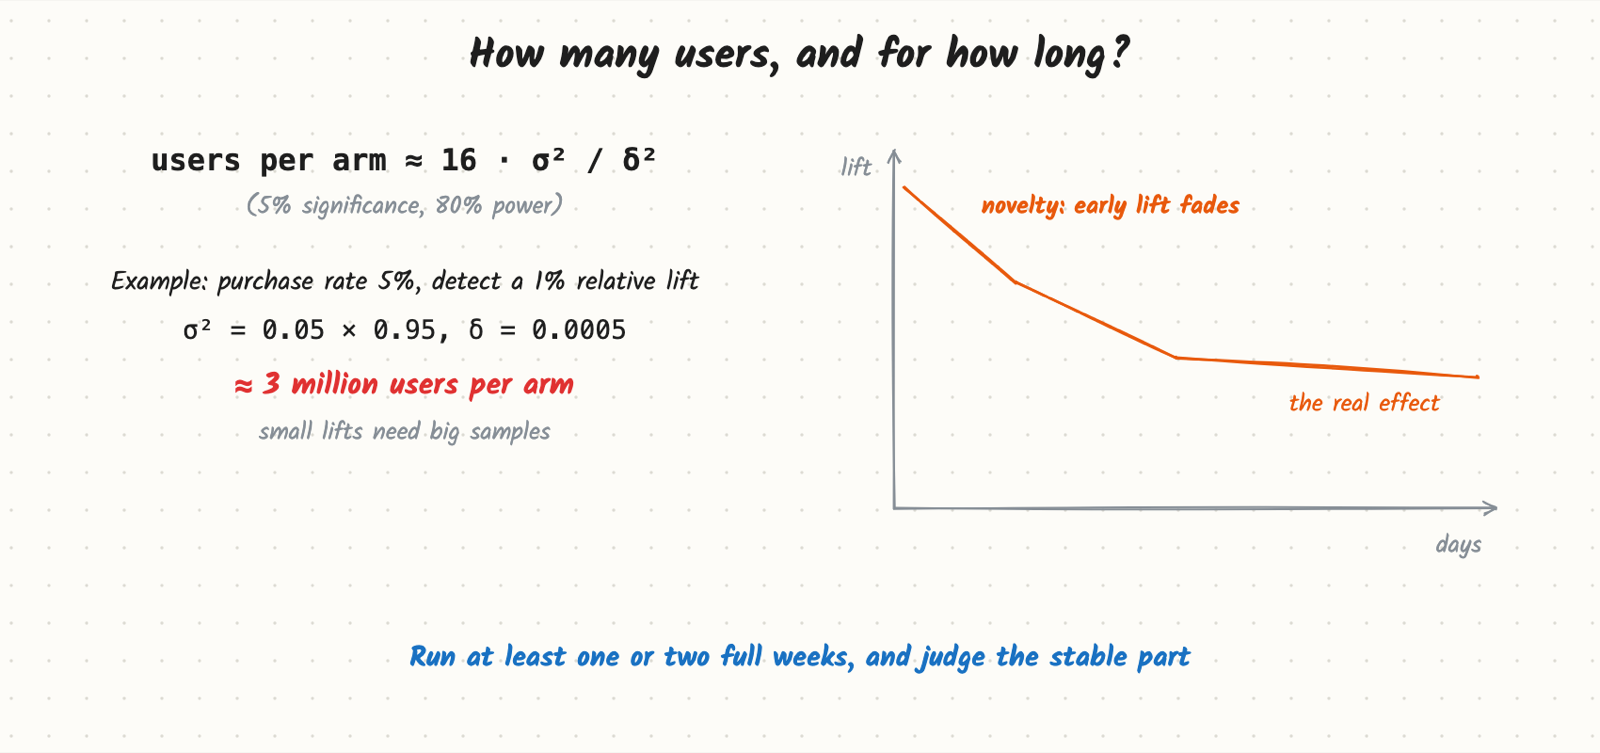
A handy rule of thumb for 5% significance and 80% power: users per arm ≈ 16 · σ² / δ², where σ² is the metric's variance and δ the smallest change you care about. For a 5% purchase rate and a 1% relative lift (δ = 0.0005), that's about 3 million users per arm. Halving the effect you want to detect quadruples the sample you need.
Then decide the duration: at least one full week so every weekday is covered, often two, so novelty effects (users click new things because they are new) and learning effects (users take time to adapt) settle down.
Traps that make results wrong
- Peeking. Checking the p-value every day and stopping the first time it dips below 0.05 inflates false positives several times over. Fix the duration in advance, or use sequential testing methods designed for continuous monitoring.
- Many metrics. Test 20 metrics and one will "win" by chance. One primary metric; the rest are guardrails or diagnostics.
- Sample ratio mismatch. If a 50/50 split arrives as 50.6/49.4 with millions of users, something is broken (a crash in one arm, a logging bug). Check this first; don't trust any result until it passes.
- Network effects. In social products, treatment users interact with control users, so effects leak between arms. Randomise by cluster (country, community, graph cluster) when this matters.
- Marketplace interference. In ride-hailing or ads, both arms compete for the same drivers or budget. Switchback tests (alternate the whole market between arms by time slot) or budget-split designs help.
- Feedback loops in training. If the treatment model's own impressions are used to train the next model, the arms are no longer independent over a long test.
Faster comparisons for ranking: interleaving
For ranking, interleaving mixes results from both models into one list for the same user and counts which model's results get clicked. It needs far fewer users than an A/B test to find which ranker is better, so teams use it to pick the best few candidates, then confirm the winner with a full A/B test on the product metric.
Trade-offs and costs
- Sensitivity versus time. Small effects need millions of users or weeks. Variance reduction (using each user's pre-experiment behaviour as a covariate, an approach often called CUPED) can cut the required sample substantially.
- Short-term versus long-term. A two-week test measures two weeks. For long-term effects, keep a small long-running holdout (1–5% of users who never get new models) and compare months later.
- Risk. Experiments expose real users to a possibly worse model. Ramp slowly and stop automatically if guardrails break.
- Not everything can be tested. Prices and some trust and safety changes raise fairness and legal concerns; use smaller, carefully designed tests or offline counterfactual estimates.
When to reach for it
Step 6 of the framework, after offline evaluation. It is also the answer to "how would you know the new model is better?", "the A/B test is positive but small, would you ship?" and "offline improved but online didn't, why?"
Example
Prompt: "Design harmful content detection." How do you A/B test a moderation model?
- Unit: randomise by content creator rather than viewer, so a creator's posts are all handled by one model.
- Primary metric: prevalence of violating content, the share of views that land on violating posts, measured by human review of a random sample of views in each arm.
- Guardrails: wrongful takedowns (successful appeals per thousand removals), creator posting rate, reviewer queue size.
- Size and duration: prevalence is measured by sampling, so the sample of reviewed views, not users, sets the precision; plan review capacity for two weeks.
- Decision: ship if prevalence drops and successful appeals don't rise more than the agreed tolerance.
Common mistakes
- No control group: launching to everyone and comparing before and after.
- Changing the primary metric after seeing results.
- Stopping early on the first significant day.
- Ignoring guardrails, so engagement wins hide rising reports.
- Random assignment per request instead of per user, so one person sees both models.
- Ignoring interference in social or marketplace products.
Say this in the interview
"Offline wins only earn the model an A/B test. I'd randomise by user, 50/50 after a 1% ramp, with watch time per user as the primary metric and reports, hides and latency as guardrails. To detect a 1% lift we need a few million users per arm, so two weeks covers the sample and lets novelty fade. I'd check sample ratio first, decide the duration up front, and keep a small long-term holdout."