Monitoring and Data Drift
On this page
A fraud model's dashboard is green: latency normal, no errors, the service is up. Meanwhile an upstream team renamed a field, and the "device age" feature has been zero for every payment for nine days. The model still returns scores; they are just worse. Nobody notices until the monthly chargeback report arrives, a few hundred thousand dollars later.
ML systems fail quietly. A normal service either answers or throws an error; a model always answers, even when its inputs are broken or the world has changed. Monitoring has to look at the data and the predictions, not just the servers.
How it works
Four layers to watch
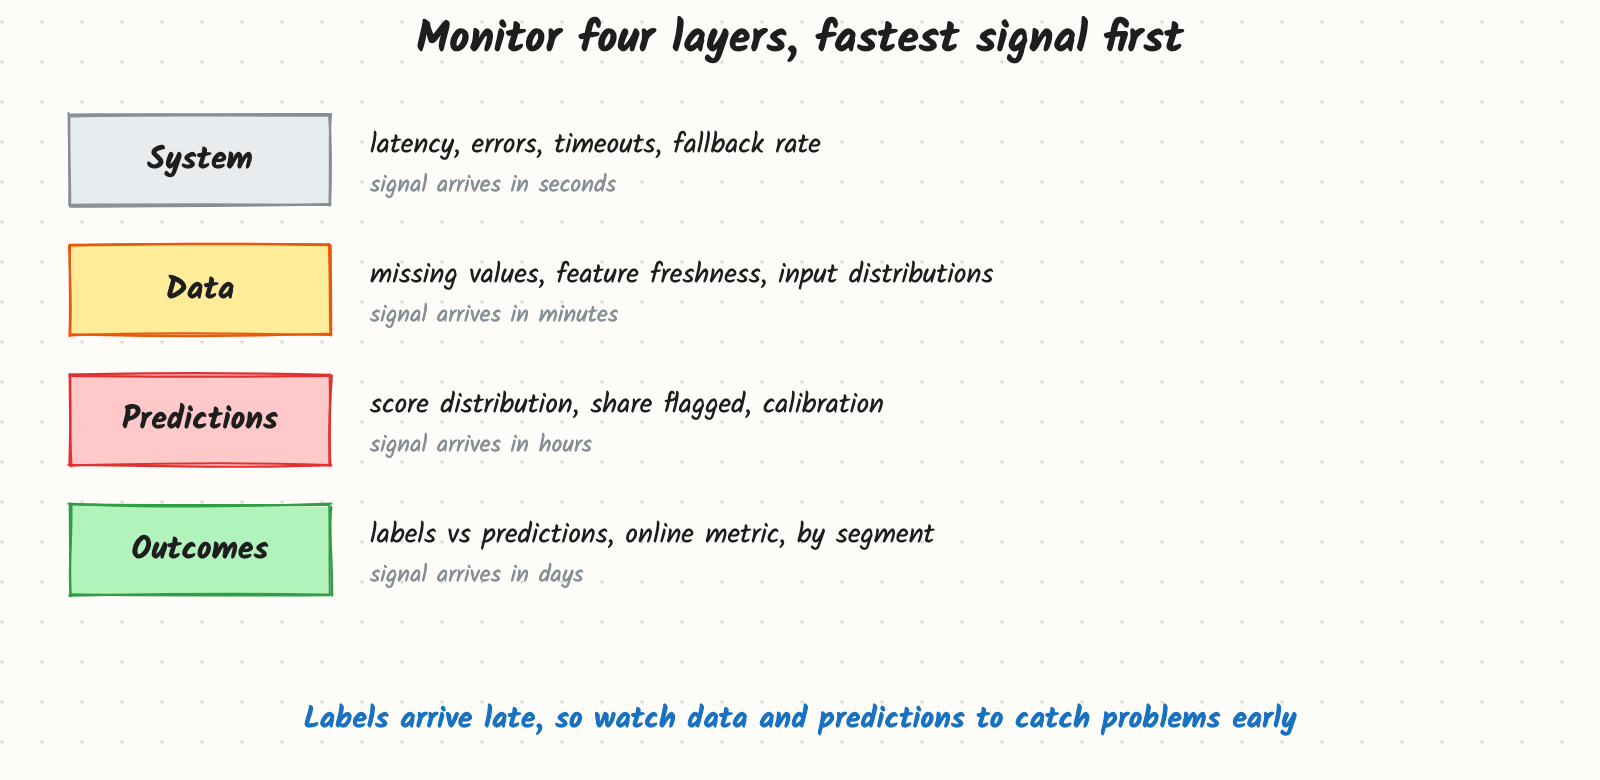
- System health: latency per stage, errors, timeouts, and how often the fallback path is used. The same as any service.
- Data (inputs): share of missing values per feature, feature freshness (when was this value last updated?), and the distribution of each important feature compared with a reference window, usually the training data or last week. A common measure is the population stability index (PSI) or a simple comparison of histograms; a PSI above about 0.2 is often treated as a significant shift.
- Predictions (outputs): the distribution of scores, the share of items flagged or blocked, the mix of items shown (how many from the top 1% of creators?), and calibration on the labels that have arrived so far.
- Outcomes: once labels arrive, offline metrics on recent data (precision, recall, NDCG) and the online business metric, broken down by segment: country, platform, new versus returning users.
The order matters because labels are slow. Chargebacks take weeks; even clicks take minutes. Input and output checks are your early warning.
Data drift and concept drift
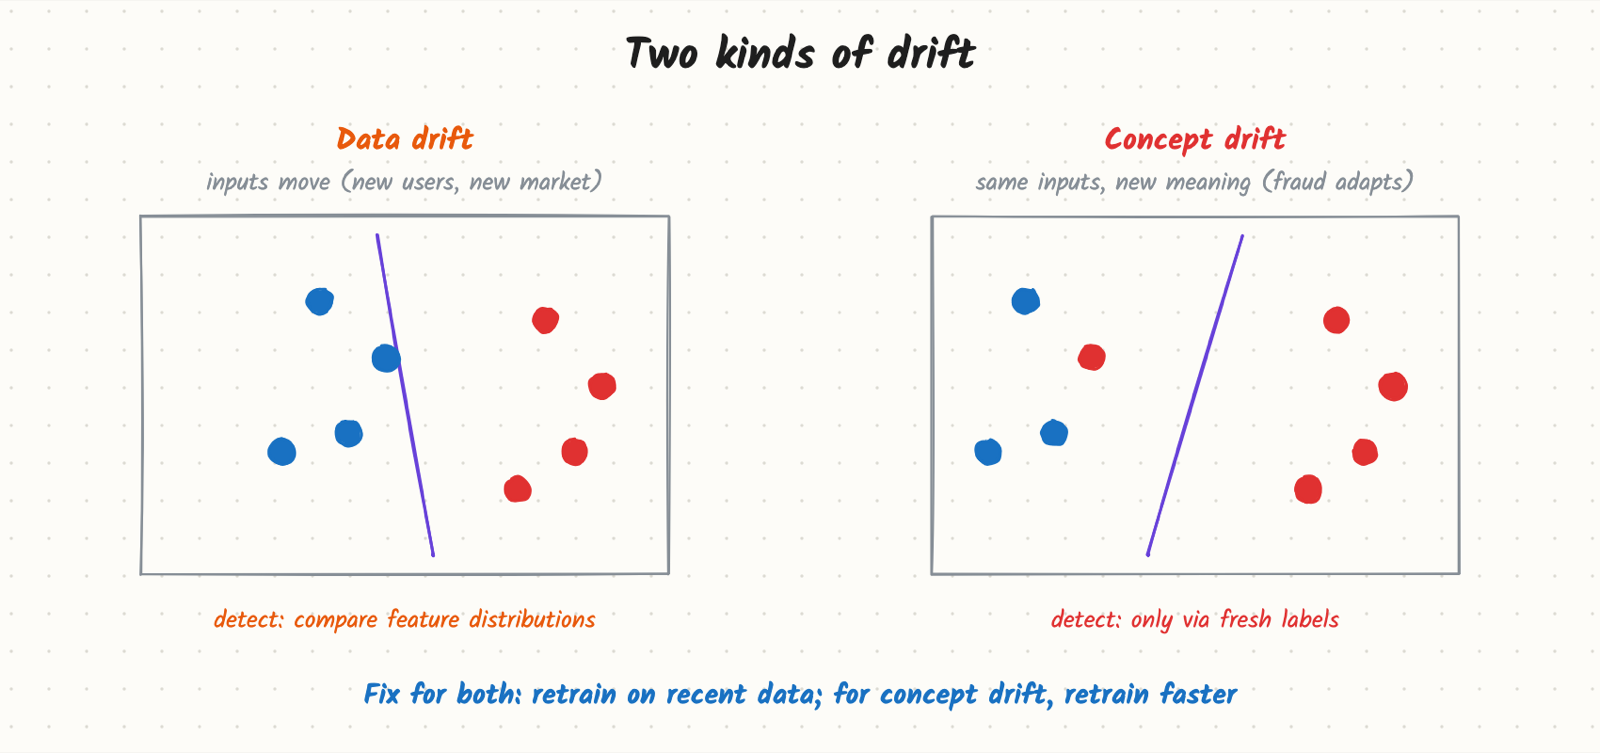
- Data drift (covariate shift): the inputs change. The app launches in a new country; a marketing campaign brings younger users; a new phone model changes a device feature. The relationship between features and label may still hold, but the model is now working in a region it saw little of. Detect it by comparing input distributions.
- Concept drift: the relationship itself changes. Fraudsters learn which patterns get blocked and change them; what people find interesting shifts during an election or a holiday. The inputs look normal, but the right answer is different. Only fresh labels reveal it.
- Label drift: the base rate changes (fraud doubles during a holiday sale), which affects thresholds and calibration.
Responding to alerts
Each alert should have a planned response:
- Broken input (missing values spike, stale feature): fix the pipeline; meanwhile fall back to a model version that doesn't use the broken feature, or to rules.
- Score distribution shift with no input change: check for a bad deploy; roll back.
- Gradual drift: retrain on recent data; consider a shorter retraining cycle or more weight on recent examples.
- Adversarial change (fraud, spam): fast retraining, human analysts writing temporary rules, and features that are harder to game.
Feedback loops
A deployed model changes the data it will be trained on. A recommender only learns about items it chose to show; a fraud model never learns whether blocked payments were truly fraud. Monitoring should include a small amount of exploration or a holdout: a slice of traffic where items are chosen with some randomness, or payments are approved without the model, so you still see unbiased outcomes. See Feedback Loops, Position Bias and Exploration for the full pattern.
Trade-offs and costs
- Sensitive alerts versus alert fatigue. Alerting on every small distribution change trains people to ignore alerts. Alert on the few features with the most importance, use thresholds tuned on past weeks, and send the rest to a dashboard.
- Holdouts cost something. Approving 0.5% of payments without the fraud model costs real fraud losses; showing random items costs engagement. Keep the slice small and its purpose clear.
- Segment breakdowns multiply dashboards. Pick the segments that matter for the product (new users, top markets, each platform) rather than every possible one.
When to reach for it
Step 7 of every answer. Also the answer to the very common "your model's performance dropped last week; how do you debug it?" Walk the layers in order: did anything change in the system (deploys, latency, fallbacks)? In the data (missing or stale features, distribution shifts)? In the predictions (score distribution)? In the world (new segment, adversary, seasonality)?
Example
Prompt: "Design ETA prediction." Monitoring plan:
- System: p99 latency of the ETA service; share of requests served by the routing-only fallback.
- Data: freshness of live traffic speeds (alert if any city's update is more than 5 minutes old); share of trips with missing GPS traces.
- Predictions: mean predicted ETA by city and hour, compared with the same hour last week.
- Outcomes: each completed trip gives a label within an hour. Track mean absolute error and the share of trips more than 5 minutes late, by city, and alert if either worsens by more than 10% over a day.
- Drift: new roads and closures show up as error growing in specific areas; a weekly retrain with the newest data handles slow change, and a city-level alert triggers an early retrain.
Common mistakes
- Monitoring only the servers. Green dashboards, broken model.
- Waiting for labels as the only signal, so problems surface weeks late.
- Only overall metrics, so a collapse in one country or platform is hidden by the average.
- No reference window: "the distribution changed" compared with what?
- Alerts with no owner or action.
- No holdout or exploration, so the model's own decisions blind it.
Say this in the interview
"Models fail quietly, so I'd monitor four layers: system health, input data, the prediction distribution, and outcomes once labels arrive, each broken down by key segments. Input and score checks are the early warning because labels lag. Data drift shows up in feature distributions; concept drift only in fresh labels, so a small holdout keeps giving unbiased labels. Each alert has a planned response: fall back, roll back, or retrain."
Used in
- Before this: Model Serving: Batch vs Online
- Next: Retrieval and Ranking: the Multi-Stage Funnel
- Related: Training Pipelines and Retraining, Feature Stores and Training-Serving Skew, Feedback Loops, Position Bias and Exploration
- Problems: Design Payment Fraud Detection, Design ETA Prediction, Design Fake Account Detection